- Lansweeper Community
- Knowledge Center
- Knowledge Base
- Integrations
- Import Lansweeper data into Microsoft Power BI
- Subscribe to RSS Feed
- Bookmark
- Subscribe
- Printer Friendly Page
- Report Inappropriate Content
This documentation is for the old UI. For documentation for the new preview UI, Knowledge Base - Preview UI.
- Article History
- Subscribe to RSS Feed
- Bookmark
- Subscribe
- Printer Friendly Page
- Report Inappropriate Content
on
11-21-2024
09:23 PM
- edited on
10-06-2025
02:39 PM
by
DiegoPacini
![]()
Learn how to import Lansweeper inventory data into Power BI. Transform your IT asset data into dynamic, visually engaging insights using Microsoft Power BI.
Deployment architecture
Microsoft Power BI platform
Microsoft Power BI is an interactive data visualization software focused on business intelligence. Power BI is a collection of software services, apps, and connectors that combine to turn unrelated data sources into coherent, visually immersive, and interactive insights.
Lansweeper platform
Lansweeper is the industry leader in device discovery, providing agentless, credential-free and credential-based device recognition, identification, and asset management across all connected IT, OT and IoT.
Lansweeper Power BI Import script
The Lansweeper Power BI Import script allows you to fetch asset information from Lansweeper and visualize the data with the help of Power BI representations.
System architecture
Prerequisites
Below is a list of requirements needed to run the dashboard template (v1.0.0) on Power BI:
The following steps require cURL to be installed. cURL is a command line tool that makes API calls. We will use cURL to communicate with Lansweeper Data API. To check if you already have it installed, run the following command in your terminal:
curl --help
If you cannot run this command, you can download it from cURL webpage.
Generate a Personal Access Token on Lansweeper
An API token is needed to make use of the Lansweeper Data API. This can be generated by following the steps below.
Create a PAT API Client on Lansweeper Sites
- Go to Lansweeper Site and log in with your Lansweeper credentials.
- Select the profile button in the top-right corner, which opens up a dropdown box. Select Developer Tools. Alternatively, if you are inside a site already, select the profile button in the bottom-left corner, then Developer Tools. Click
- Select All API Clients > Add new API client.
- Select Personal Access Token (PAT), fill out the required fields and click Continue.
- Choose the token expiration time and the sites you would like to grant access to, then Allow.
- Copy the generated API Token.
The API Token won't be visible again, so please store it for future use. For more information, check authorization section from the Data API documentation.
Get Site IDs
Your Site ID is required to identify a site for which we want to fetch data. This ID can be obtained by making an API call to Lansweeper:
- Run the following cURL command in your terminal:
curl --location ^
--request POST "https://api.lansweeper.com/api/v2/graphql" ^
--header "Authorization: Token YOUR_IDENTITY_CODE" ^
--header "Content-Type: application/json" ^
--data-raw "{ \"query\": \"{ authorizedSites { sites { id name } } }\"}"- After running the command you will get a response including the list of sites you can access. You can then note the site's ID that you want to use in Power BI.
- For example, take a look at the response given below:
{
    "data":{
        "authorizedSites":{
            "sites":
            [
                {
                    "id":"401dxxxx-xxxx-xxxx-xxxx-xxxxxxxx48ca",
                    "name":"API-demo-data"
                },
                {
                    "id":"56d4xxxx-xxxx-xxxx-xxxx-xxxxxxxx5c76",
                    "name":"API-demo-data-v2"
                }
            ]
        }
    }
}
You can use
401dxxxx-xxxx-xxxx-xxxx-xxxxxxxx48ca (for the site named API-demo-data) or 56d4xxxx-xxxx-xxxx-xxxx-xxxxxxxx5c76 (for the site named API-demo-data-v2) as site IDs.Import Lansweeper data into Power BI Desktop
In this section we will see how to import Lansweeper data in Power BI from scratch.
Power BI Desktop is required which can be downloaded from this link. Once Power BI Desktop is downloaded and installed, create a new dashboard template:
- Launch Power BI Desktop.
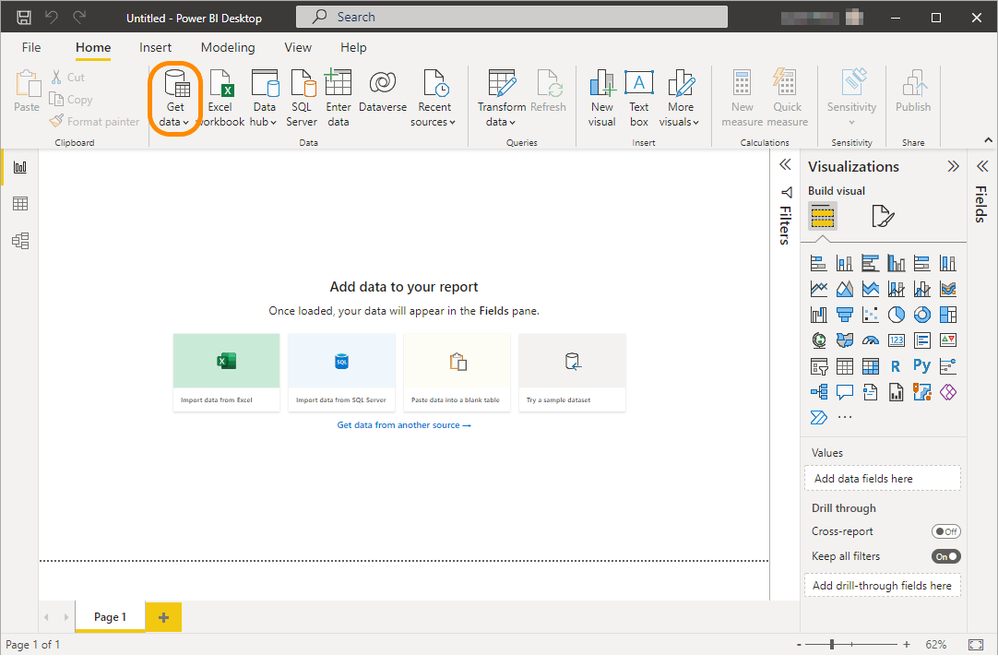
- Select Get data.
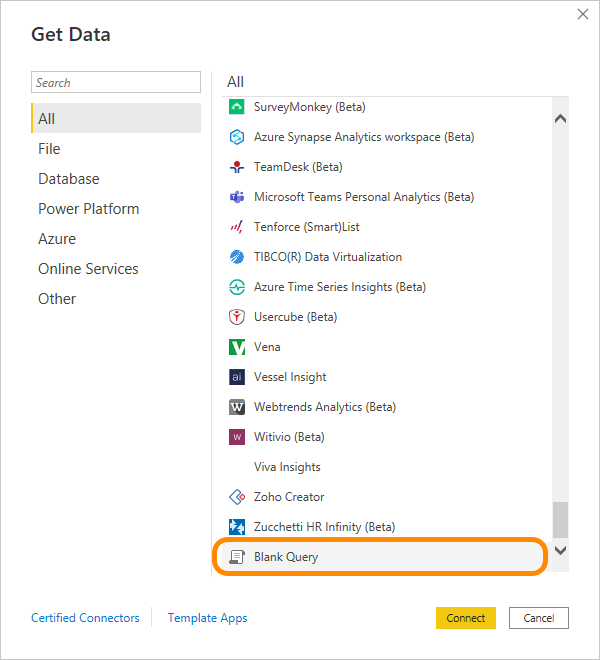
- Select Blank Query > Connect. This will open up the Power Query Editor for your import script.
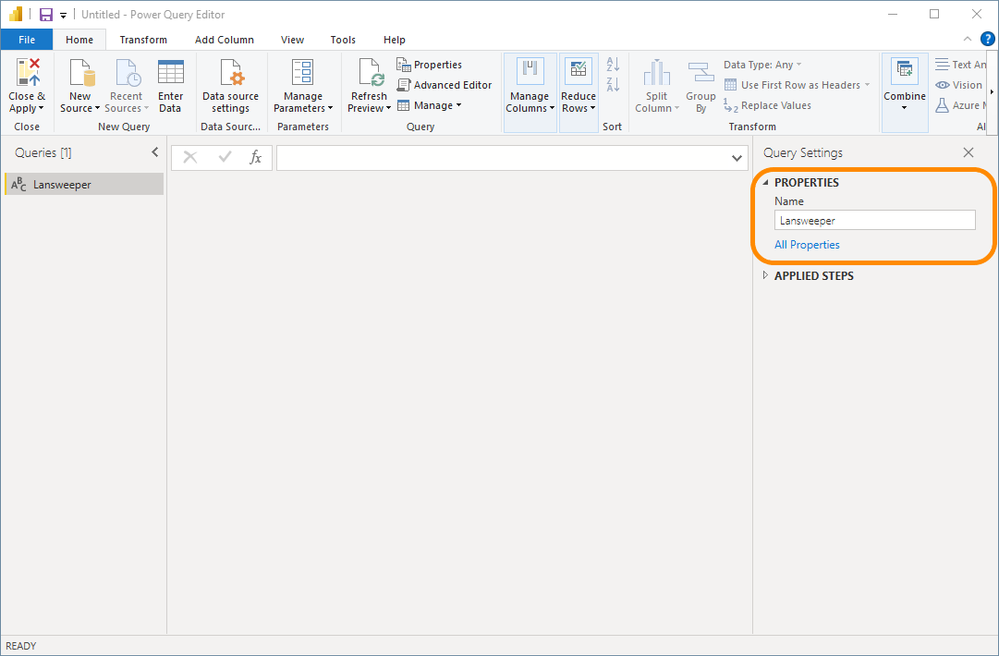
- A PROPERTIES section is on the right side of the Query Settings section. From here, you can change the query's name. You should rename the query to Lansweeper so it can be referenced later.
5. Now we need to create two parameters that will be used in our query.
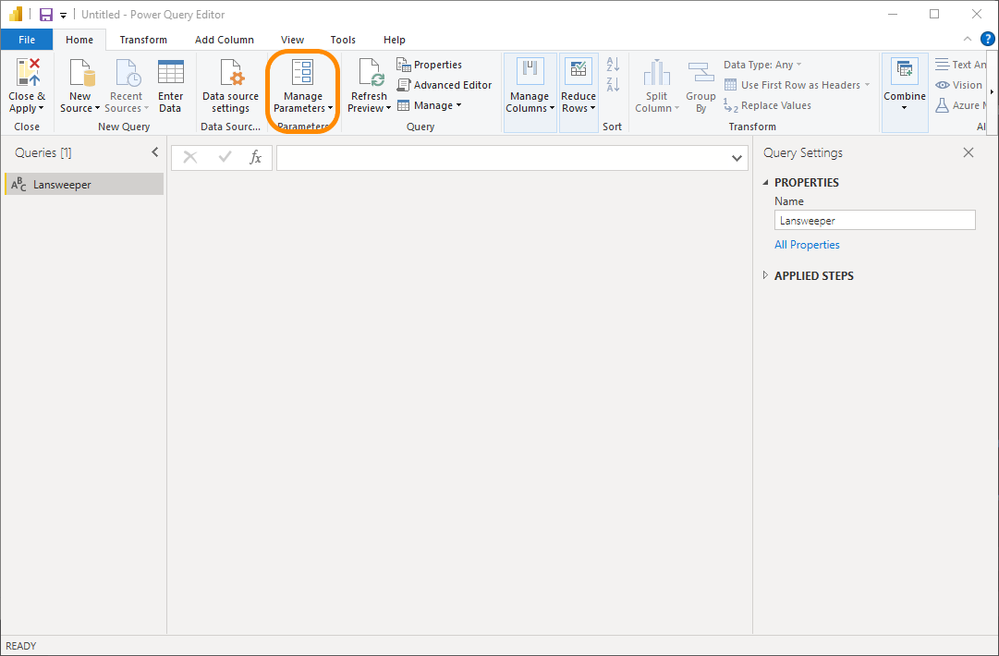
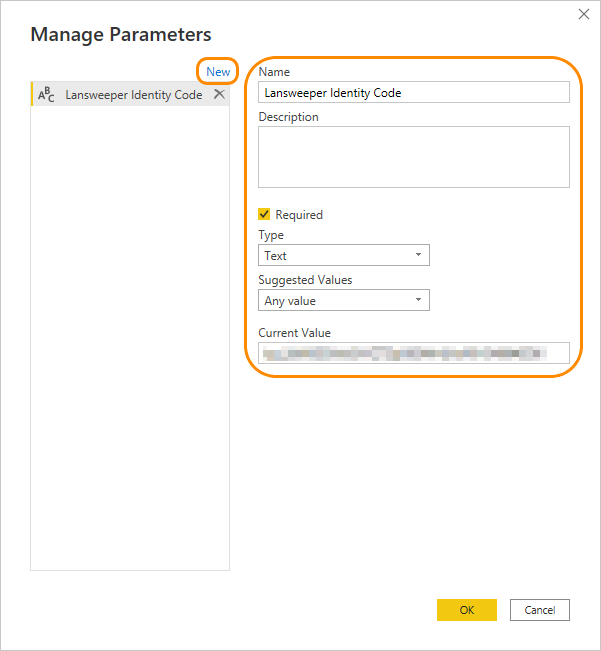
- In the Power Query Editor, go to the Home tab and click on the Manage Parameters button.
- Click on New and enter the following values:
- Name: Lansweeper Identity Code
- Type: Text
- For Current Value, provide the generated Identity Code (API Token) for your Lansweeper API Client.
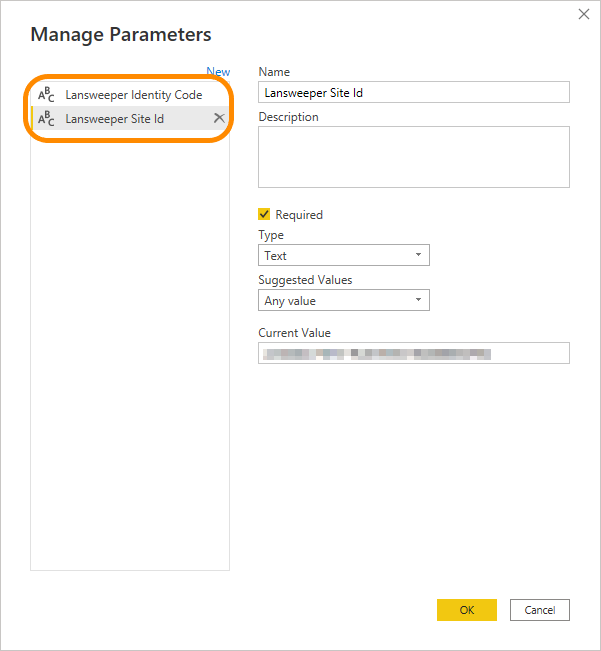
- Similarly, perform the above steps to add the parameter Lansweeper Site Id. Set the Type for this parameter as text and provide an appropriate value in the Current Value field.
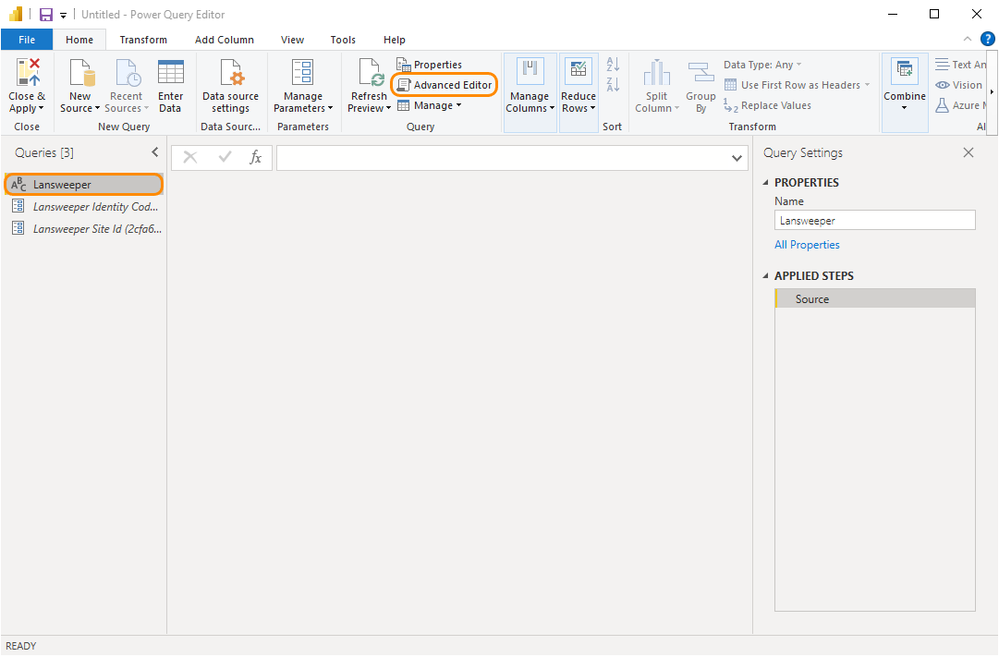
6. In the Power Query Editor, select your Query from the left window pane.
7. Go to the Home tab in your top menu bar and click the Advanced Editor button under the Query section. This will open up the Advanced Editor dialog box, and you can edit the query as needed.
To get started, you can refer to the below code.
You can directly copy and paste this Power BI query to get the data (after modifying the proper fields according to your use case if needed).
NOTE: The script uses the Lansweeper Data API assetResources query. You need to be familiar with the Lansweeper Data API in order to modify the query and change the fields you want to import into Power BI. Please have also a look at the Lansweeper Data API restrictions.
In power query, all code must be covered by let and in, where all our code will reside after let. After in you can mention the variable which you want to access in the Power BI. Each piece of code (this includes all lines and function endings) must be separated by , except the last line before in. For example, running the below query will give the result 1.
let
    a = "1"
in
    a
let
apiCall =
(query as text) =>
let
// Making an actual API call
Source =
Web.Contents(
"https://api.lansweeper.com",
[
RelativePath = "/api/v2/graphql",
Headers = [
#"Method" = "POST",
#"Content-Type" = "application/json",
#"Accept" = "*/*",
#"Authorization" =
Text.Combine(
{
"Token ",
#"Lansweeper Identity Code"
}
)
],
Content = Text.ToBinary(query)
]
),
// Converting response to JSON
#"JSON" = Json.Document(Source)
in
#"JSON",
siteId = #"Lansweeper Site Id",
startCollection =
() =>
let
resp =
// Making an api call for the first page
apiCall(
Text.Format(
"{""query"": ""query getAssetResources { site(id: \""#{0}\"") { assetResources( pagination: { limit: 500, page: FIRST }, fields: [\""assetBasicInfo.upTime\"", \""assetBasicInfo.domain\"", \""assetBasicInfo.name\"", \""assetBasicInfo.userDomain\"", \""assetBasicInfo.userName\"", \""assetBasicInfo.description\"", \""assetBasicInfo.firstSeen\"", \""assetBasicInfo.fqdn\"", \""assetBasicInfo.ipAddress\"", \""assetBasicInfo.lastSeen\"", \""assetBasicInfo.mac\"", \""assetBasicInfo.type\"", \""assetBasicInfo.lastChanged\"", \""assetBasicInfo.lsPushVersion\"", \""assetBasicInfo.lsAgentVersion\"", \""assetBasicInfo.lastActiveScan\"", \""assetBasicInfo.lastIpScan\"", \""assetBasicInfo.lastLsAgent\"", \""assetBasicInfo.lastLsFallBack\"", \""assetBasicInfo.lastLsPush\"", \""assetBasicInfo.lastPerformanceScan\"", \""assetBasicInfo.lastSccmScan\"", \""assetBasicInfo.lastScheduled\"", \""assetBasicInfo.lastTried\"", \""assetBasicInfo.lastTriggered\"", \""assetBasicInfo.lastWorkGroupScan\"", \""assetCustom.manufacturer\"", \""softwares.publisher\"", \""operatingSystem.caption\""] ) { total pagination { limit current next page } items } }}""}",
{siteId}
)
)
in
resp,
getData =
(next as nullable text, currentResults as list) =>
let
data =
// If next is null return the current results
if next = null then
currentResults
// If next is not null call the api again with current cursor
// and combine the results
else
let
resp =
apiCall(
Text.Format(
"{""query"": ""query getAssetResources { site(id: \""#{0}\"") { assetResources( pagination: { limit: 500, cursor:\""#{1}\"", page: NEXT }, fields: [\""assetBasicInfo.upTime\"", \""assetBasicInfo.domain\"", \""assetBasicInfo.name\"", \""assetBasicInfo.userDomain\"", \""assetBasicInfo.userName\"", \""assetBasicInfo.description\"", \""assetBasicInfo.firstSeen\"", \""assetBasicInfo.fqdn\"", \""assetBasicInfo.ipAddress\"", \""assetBasicInfo.lastSeen\"", \""assetBasicInfo.mac\"", \""assetBasicInfo.type\"", \""assetBasicInfo.lastChanged\"", \""assetBasicInfo.lsPushVersion\"", \""assetBasicInfo.lsAgentVersion\"", \""assetBasicInfo.lastActiveScan\"", \""assetBasicInfo.lastIpScan\"", \""assetBasicInfo.lastLsAgent\"", \""assetBasicInfo.lastLsFallBack\"", \""assetBasicInfo.lastLsPush\"", \""assetBasicInfo.lastPerformanceScan\"", \""assetBasicInfo.lastSccmScan\"", \""assetBasicInfo.lastScheduled\"", \""assetBasicInfo.lastTried\"", \""assetBasicInfo.lastTriggered\"", \""assetBasicInfo.lastWorkGroupScan\"", \""assetCustom.manufacturer\"", \""softwares.publisher\"", \""operatingSystem.caption\""] ) { total pagination { limit current next page } items } }}""}",
{
siteId,
next
}
)
),
combinedResults =
List.Combine(
{
currentResults,
@getData(
resp[data][site][assetResources][pagination][next],
resp[data][site][assetResources][items]
)
}
)
in
combinedResults
in
data,
// Initial response
resp = startCollection(),
// Final output
output =
getData(
resp[data][site][assetResources][pagination][next],
resp[data][site][assetResources][items]
),
// Convert to Table
#"Converted to Table" =
Table.FromList(
output,
Splitter.SplitByNothing(),
null,
null,
ExtraValues.Error
),
// Expanding nested records
#"Expanded Column1" =
Table.ExpandRecordColumn(
#"Converted to Table",
"Column1",
{
"_id",
"assetBasicInfo",
"assetCustom",
"operatingSystem",
"softwares"
},
{
"_id",
"assetBasicInfo",
"assetCustom",
"operatingSystem",
"softwares"
}
),
// Expanding fields contained in assetBasicInfo
#"Expanded assetBasicInfo" =
Table.ExpandRecordColumn(
#"Expanded Column1",
"assetBasicInfo",
{
"domain",
"userDomain",
"fqdn",
"ipAddress",
"name",
"mac",
"firstSeen",
"lastSeen",
"lastTried",
"lastChanged",
"type",
"userName",
"description",
"lsAgentVersion",
"upTime",
"lastIpScan",
"lastSccmScan",
"lastPerformanceScan",
"lastTriggered",
"lastScheduled",
"lastLsPush",
"lsPushVersion"
},
{
"domain",
"userDomain",
"fqdn",
"ipAddress",
"name",
"mac",
"firstSeen",
"lastSeen",
"lastTried",
"lastChanged",
"type",
"userName",
"description",
"lsAgentVersion",
"upTime",
"lastIpScan",
"lastSccmScan",
"lastPerformanceScan",
"lastTriggered",
"lastScheduled",
"lastLsPush",
"lsPushVersion"
}
),
// Expanding fields contained in assetCustom
#"Expanded assetCustom" =
Table.ExpandRecordColumn(
#"Expanded assetBasicInfo",
"assetCustom",
{"manufacturer"},
{"manufacturer"}
),
// Expanding fields contained in operatingSystem
#"Expanded operatingSystem" =
Table.ExpandRecordColumn(
#"Expanded assetCustom",
"operatingSystem",
{"caption"},
{"caption"}
),
// Taking the first element from the OS list.
#"Added Custom" =
Table.AddColumn(
#"Expanded operatingSystem",
"publisher",
each List.First([softwares])
),
// Handling errors occurred during accessing empty list.
#"Replaced Errors" =
Table.ReplaceErrorValues(
#"Added Custom",
{
{
"publisher",
null
}
}
),
// Expanding publisher
#"Expanded publisher" =
Table.ExpandRecordColumn(
#"Replaced Errors",
"publisher",
{"publisher"},
{"publisher"}
)
in
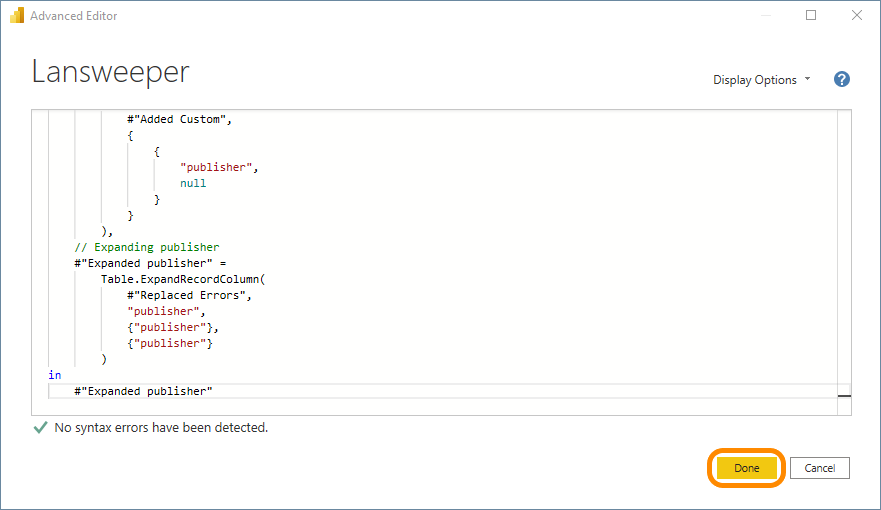
#"Expanded publisher"- Once the query is edited, select Done.
- In the Power Query Editor, go to the Home tab in your top menu bar and select Close & Apply.
- If you see a connection error as below, simply click on Edit Credentials and then on Connect

10. Now you'll be able to see the Lansweeper data imported into Power BI and you can start using the data in your dashbaords.
Troubleshoot
This section describes the common issues that might happen during the running of the integration and the steps to resolve the issues.
Refresh is not working or it is taking too much time
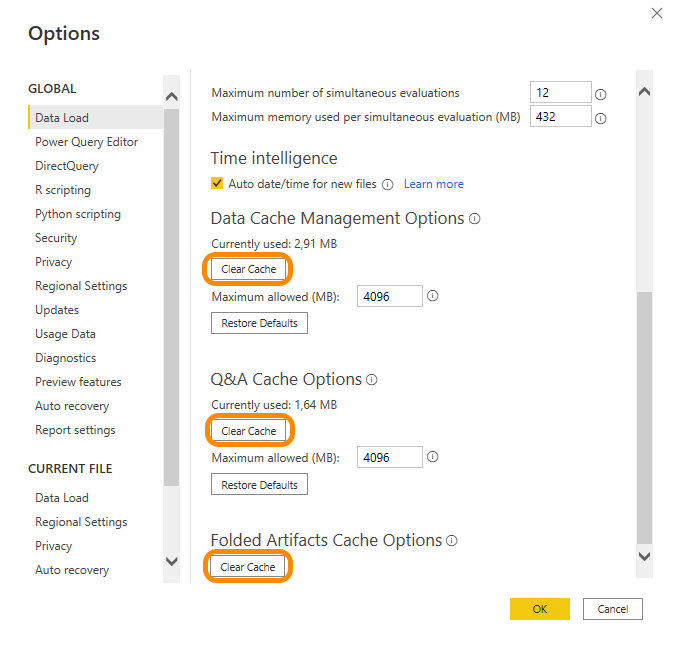
If the refresh feature is not working consistently, it is most likely an issue on the Power BI side. If you are using the Power BI desktop, you can try clearing the cache. Follow the below steps to clear the cache.
In Power BI Desktop navigate to File > Options and Settings > Options > Data Load.
On the right side, scroll to the bottom and select the three Clear cache options individually.
New to Lansweeper?
Try Lansweeper For Free
Experience Lansweeper with your own data. Sign up now for a 14-day free trial.
Try Now

