- Lansweeper Community
- Forums
- Reports & Analytics
- Chart Widget: Tickets per client's department summ...
- Subscribe to RSS Feed
- Mark Topic as New
- Mark Topic as Read
- Float this Topic for Current User
- Bookmark
- Subscribe
- Mute
- Printer Friendly Page
- Mark as New
- Bookmark
- Subscribe
- Mute
- Subscribe to RSS Feed
- Permalink
- Report Inappropriate Content
08-02-2023 05:36 PM - last edited on 03-31-2024 03:50 PM by Mercedes_O
Hi,
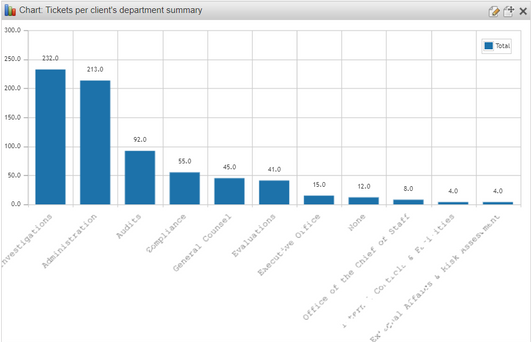
Can anyone help clear up the confusion regarding this Chart Widget included in the add-in for the Dashboard and the numbers that its reporting please? I'm not sure of the vertical or horizontal number and where they are coming from. Also, what is the look-back timeframe for these total values? These number does not seem to represent my current HD ticket values for these indicated department, any assistance in explaining these values would be r greatly appreciated.
- Labels:
-
Built-In Reports
Reports & Analytics
Ask about reports you're interested in and share reports you've created. Subscribe to receive daily updates of reports shared in the Community.
New to Lansweeper?
Try Lansweeper For Free
Experience Lansweeper with your own data. Sign up now for a 14-day free trial.
Try Now

