- Lansweeper Community
- Knowledge Center
- Knowledge Base
- Scanning your network
- How to scan performance information of Windows and...
- Subscribe to RSS Feed
- Bookmark
- Subscribe
- Printer Friendly Page
- Report Inappropriate Content
- Article History
- Subscribe to RSS Feed
- Bookmark
- Subscribe
- Printer Friendly Page
- Report Inappropriate Content
01-22-2019 07:30 PM - edited 06-05-2024 09:11 AM
Since Lansweeper version 7.2, the performance data of Linux computers can be scanned. This in addition to the already existing performance scanning feature for Windows computers, which was introduced in version 7.1.
Performance scanning is the high interval scanning of specific assets to retrieve key resource usage information. Specifically, you can monitor the following resources and see them displayed in a Windows and Linux computer's Performance tabs: CPU, RAM, disks and network traffic. By default, performance data is only scanned for your Lansweeper server itself. For other client machines, performance counter scanning must be manually enabled, instructions for which can be found in this article.
For Windows computers, performance information is retrieved remotely through WMI (Windows Management Instrumentation), a management infrastructure built into Windows operating systems.
For Linux computers, the /proc/stat, /proc/diskstats and /proc/net/dev files are accessed and the df, grep and free commands are run. No Lansweeper software is needed on the Windows or Linux client machine whose data you want to scan.
Step 1: perform a successful agentless scan
Make sure your Windows and Linux computers have been successfully scanned without an agent at least once. Instructions for setting up scanning of Windows and Linux computers can be found below.
- Windows scanning requirements
- How to scan a Windows computer
- Linux scanning requirements
- How to scan a Linux computer
Step 2: configure cleanup options
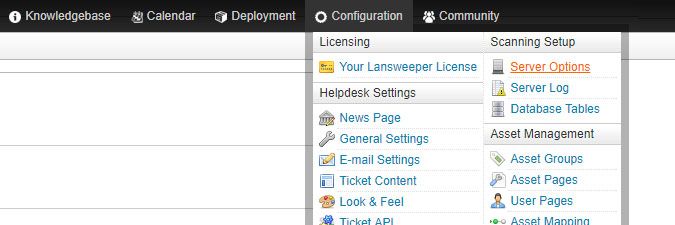
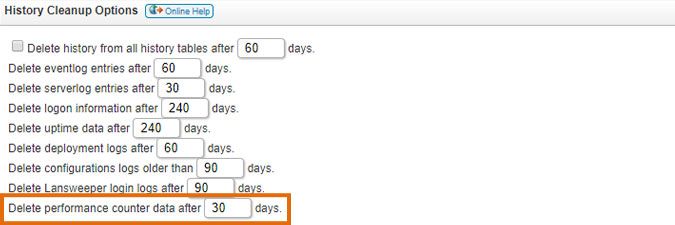
Browse to the Configuration > Server Options section of the web console. Lower the "Delete performance counter data after XX days" setting as much as possible, in the History Cleanup Options section of the page. Once you've configured performance scanning, this setting will determine how long the data is kept in the database. We recommend keeping the data only for as long as strictly required, to prevent unnecessary database growth.
Step 3: set up the scanning target for performance monitoring
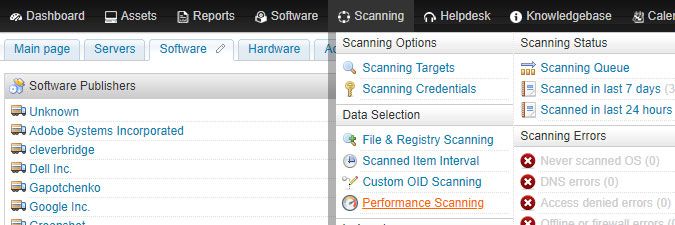
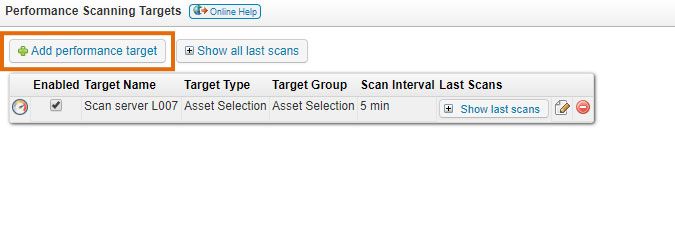
Browse to the Scanning > Performance Scanning section of the web console and select Add performance target. By default, there will already be a target on the page to scan the performance information of your Lansweeper scanning server itself.
Specify a name, target and interval. The minimum interval is 15 minutes. By default, the interval is set to 1 hour. Your target can be an Asset Group, Report or Selection. You can add any report, static group or dynamic group that contains any number of Windows and/or Linux assets. If you choose the selection option, the Select Assets button will appear. Afterwards simply wait.
An initial performance scan of the specified machines is immediately run and any subsequent scans are automatically executed based on the schedule you configured. If you have multiple scanning servers, a Windows or Linux computer's performance scan is executed by the last scanning server that performed a general scan of the machine. When a performance scan is taking place, you can see the Windows or Linux computer in your scanning queue under Scanning > Scanning Queue.
Step 4: view the performance monitoring results
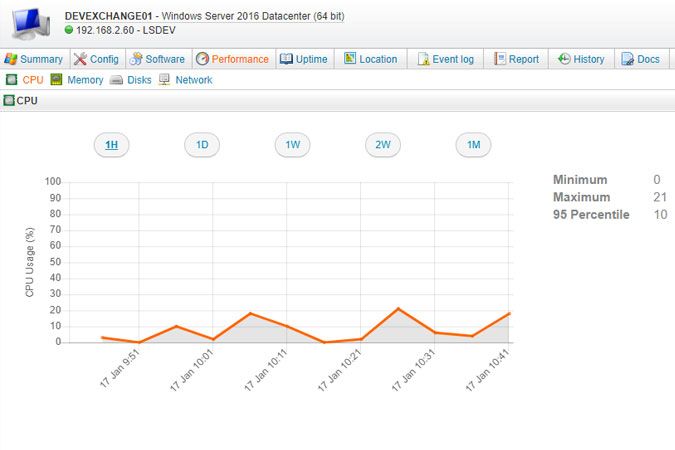
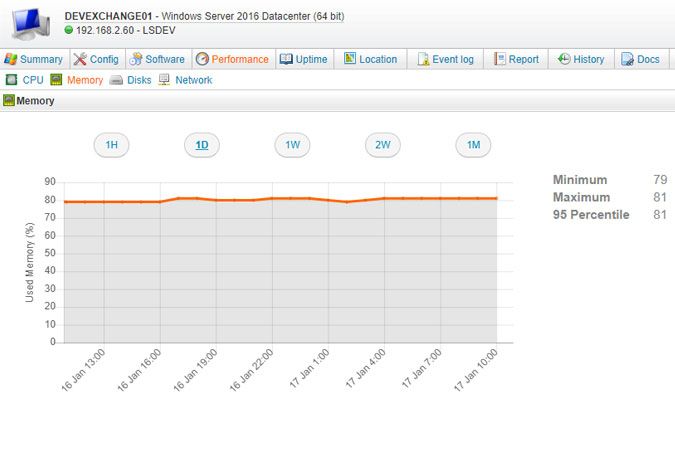
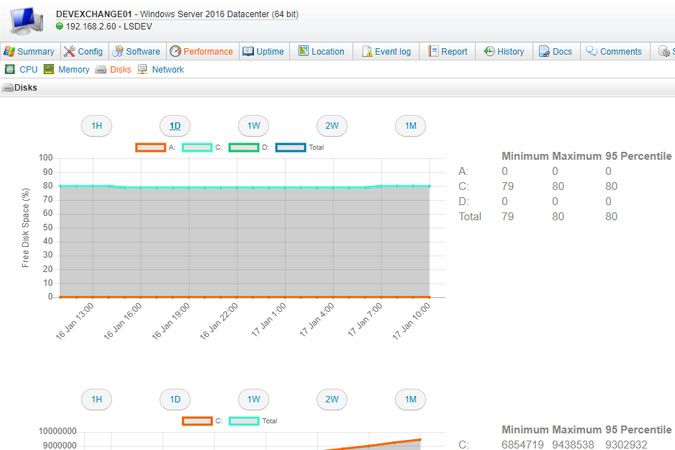
View scanned data in the Performance tab of your Windows and Linux computer webpages. Information on when the last performance scan was executed can also be found under this tab. Performance counter data includes processor, memory, hard drive and bandwidth usage. CPU and memory usage are scanned as percentages. Disk data includes (per disk and total) percentage of used disk space, disk reads per second, disk writes per second and disk transfers per second. Network interface data includes (per interface and in MB) network traffic received, network traffic sent and total network traffic.
The buttons at the top of each tab can be used to change the displayed time frame: 1 hour, 1 day, 1 week, 2 weeks or 1 month. Minimum, maximum and 95th percentile values are displayed for each resource as well. If you select a 1D or 1W view, an average value is calculated per hour and each hour is a data point. If you select a 2W or 1M view, an average value is calculated per day and each day is a data point. If a machine's performance data can temporarily not be scanned, because the machine is offline for instance, there will be a gap in the line graph for that time frame.
New to Lansweeper?
Try Lansweeper For Free
Experience Lansweeper with your own data. Sign up now for a 14-day free trial.
Try Now