This website uses cookies. By clicking Accept, you consent to the use of cookies. Click Here to learn more about how we use cookies.
Community FAQ
Register | Log In
Turn on suggestions
Auto-suggest helps you quickly narrow down your search results by suggesting possible matches as you type.
Turn on suggestions
Auto-suggest helps you quickly narrow down your search results by suggesting possible matches as you type.
- Lansweeper Community
- Forums
- Deployment Packages
- Question about vulnerability chart
Options
- Subscribe to RSS Feed
- Mark Topic as New
- Mark Topic as Read
- Float this Topic for Current User
- Bookmark
- Subscribe
- Mute
- Printer Friendly Page
Register to ask a question, start a topic or share an idea
Join the Community
Options
- Mark as New
- Bookmark
- Subscribe
- Mute
- Subscribe to RSS Feed
- Permalink
- Report Inappropriate Content
06-11-2025 08:42 PM
Hi,
I would like to know if it is possible to generate this pie chart in a line chart?
If so, I would also like to know if it is possible to generate a graph with the data from when I installed Lansweeper so that I can see the work history of the vulnerabilities?


Labels:
- Labels:
-
Deployment discussions
2 REPLIES 2
Options
- Mark as New
- Bookmark
- Subscribe
- Mute
- Subscribe to RSS Feed
- Permalink
- Report Inappropriate Content
06-16-2025 09:35 AM
Hello,
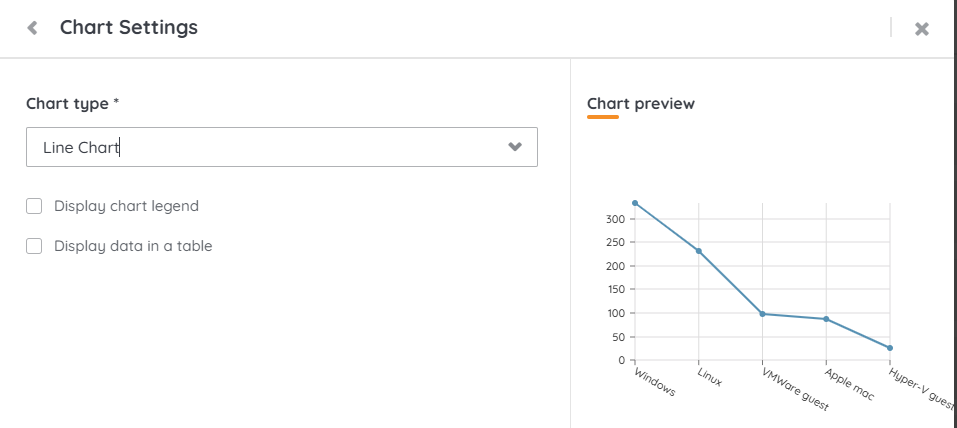
You can create a new dashboard and from there add a new chart.
When selecting the data you want to see, you can select another chart type.
Options
- Mark as New
- Bookmark
- Subscribe
- Mute
- Subscribe to RSS Feed
- Permalink
- Report Inappropriate Content
06-16-2025 02:14 PM
Hi,
Please, could you send the tutorial and the historical question, can I generate the vulnerability graph from... let's say from January 2025 to the current date?
Deployment Packages
Share topics/ issues related to deployment packages. Please use/rely on content with caution as it is publicly generated.
New to Lansweeper?
Try Lansweeper For Free
Experience Lansweeper with your own data. Sign up now for a 14-day free trial.
Try Now