This website uses cookies. By clicking Accept, you consent to the use of cookies. Click Here to learn more about how we use cookies.
Community FAQ
Register | Log In
Turn on suggestions
Auto-suggest helps you quickly narrow down your search results by suggesting possible matches as you type.
Turn on suggestions
Auto-suggest helps you quickly narrow down your search results by suggesting possible matches as you type.
- Lansweeper Community
- Forums
- General Discussions
- Why does this keep happening?
Options
- Subscribe to RSS Feed
- Mark Topic as New
- Mark Topic as Read
- Float this Topic for Current User
- Bookmark
- Subscribe
- Mute
- Printer Friendly Page
Register to ask a question, start a topic or share an idea
Join the Community
Options
- Mark as New
- Bookmark
- Subscribe
- Mute
- Subscribe to RSS Feed
- Permalink
- Report Inappropriate Content
07-25-2019 12:26 AM
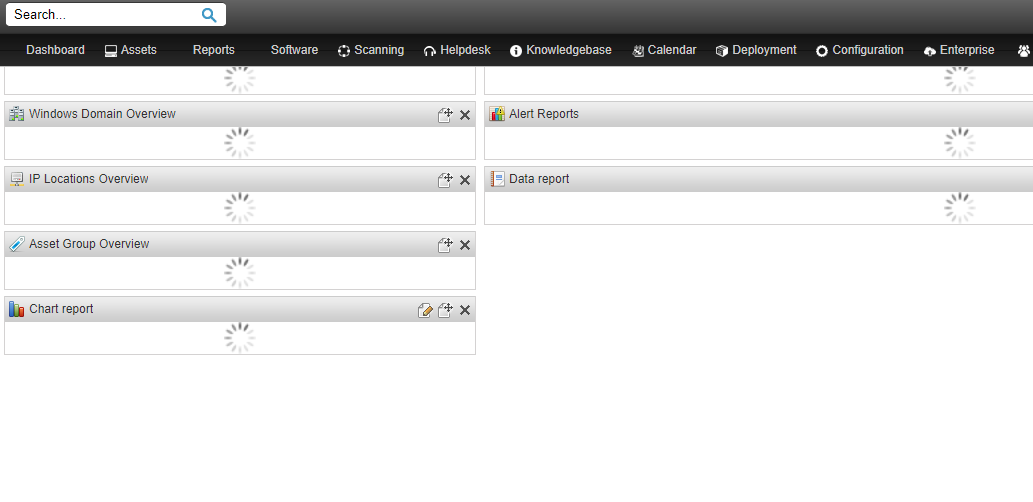
Every day we have to hit refresh a thousand times and re-log in to get Lansweeper to function correctly. See the screenshot to see what it looks like. It happens every day.
We have reinstalled Lansweeper, run through the database cleanup checklist, but have not figured out why this happens.
Does this happen to anyone else?
We have reinstalled Lansweeper, run through the database cleanup checklist, but have not figured out why this happens.
Does this happen to anyone else?
Labels:
- Labels:
-
General Discussion
3 REPLIES 3
Options
- Mark as New
- Bookmark
- Subscribe
- Mute
- Subscribe to RSS Feed
- Permalink
- Report Inappropriate Content
07-31-2019 04:32 PM
Hi blasto,
We were having similar issues. First off the Lansweeper scanning service was dying frequently as there is an issue with warranty scanning. We are still waiting for a fix for this.
To mitigate the unscanned servers mostly, I have setup something like this:
For the slow dashboard, do the following. Wait until the alert widget loaded successfully. Then open one after the other report in a new window and take a note of those reports that take longer than a second to load.
Maybe you are as lucky as I was and find 1 or 2 that take about a minute to load. If that's the case, change the order of the where clause and see if it speeds up (< 1 second). If not, maybe exclude the report from the alert widget.
That worked for us and I hope it does for you
We were having similar issues. First off the Lansweeper scanning service was dying frequently as there is an issue with warranty scanning. We are still waiting for a fix for this.
To mitigate the unscanned servers mostly, I have setup something like this:
- Create a new deployment with the only action = Command, Name = Hello, Command = echo hello world, Success, Success
- Tick the "Rescan Assets" box
- Schedule this to run against the following report on a daily basis
Select Top 1000000 tblAssets.AssetID,
tblAssets.AssetName,
tsysAssetTypes.AssetTypename,
tsysAssetTypes.AssetTypeIcon10 As icon,
tblAssets.IPAddress,
tblAssets.Lastseen,
tblAssets.Lasttried
From tblAssets
Inner Join tblAssetCustom On tblAssets.AssetID = tblAssetCustom.AssetID
Inner Join tsysAssetTypes On tsysAssetTypes.AssetType = tblAssets.Assettype
Where tblAssets.Lastseen < DateAdd(dd, -3, GetDate()) And tblAssetCustom.State =
1 And tblAssets.OScode Like '%s'
Order By tblAssets.Lastseen
For the slow dashboard, do the following. Wait until the alert widget loaded successfully. Then open one after the other report in a new window and take a note of those reports that take longer than a second to load.
Maybe you are as lucky as I was and find 1 or 2 that take about a minute to load. If that's the case, change the order of the where clause and see if it speeds up (< 1 second). If not, maybe exclude the report from the alert widget.
That worked for us and I hope it does for you
Options
- Mark as New
- Bookmark
- Subscribe
- Mute
- Subscribe to RSS Feed
- Permalink
- Report Inappropriate Content
07-25-2019 11:09 AM
Try removing the Alert Report widget and see if that has any impact.
What is your database (SQL Compact or SQL Server) and web server setup (IIS Express or IIS) like?
Maybe this topic helps: https://www.lansweeper.com/forum/yaf_postst17188_LS-Dashboard-Reports-Broken.aspx
What is your database (SQL Compact or SQL Server) and web server setup (IIS Express or IIS) like?
Maybe this topic helps: https://www.lansweeper.com/forum/yaf_postst17188_LS-Dashboard-Reports-Broken.aspx
Options
- Mark as New
- Bookmark
- Subscribe
- Mute
- Subscribe to RSS Feed
- Permalink
- Report Inappropriate Content
07-25-2019 03:01 PM
Esben.D wrote:
Try removing the Alert Report widget and see if that has any impact.
What is your database (SQL Compact or SQL Server) and web server setup (IIS Express or IIS) like?
Maybe this topic helps: https://www.lansweeper.com/forum/yaf_postst17188_LS-Dashboard-Reports-Broken.aspx
We're running SQL Server with IIS Express. Do we need full blown IIS? The database and server all look healthy. Has this never been an issue for you?
General Discussions
Find answers to technical questions about Lansweeper.
New to Lansweeper?
Try Lansweeper For Free
Experience Lansweeper with your own data. Sign up now for a 14-day free trial.
Try Now
Related Content
- What happens to scans that are in progress when a restart occurs? in Technical Support Solutions
- Issue with actions after a loop in Flow Builder
- Windows Secure Boot certificate expiration and CA updates report? in Reports & Analytics
- Auto-Update fails to install and Lansweeper goes offline in General Discussions
- Risk Insights Broken, All assets show 0 vulnerabilities in General Discussions
